The road to the “Smart Grid” is associated with significant challenges. We must implement the technological transition from a passive distribution grid to an actively managed distribution grid at low-voltage levels. But that’s not all. Grids must also learn to cope with voltage fluctuations caused by the increasing decentralised generation of renewable energies, modern storage options and, last but by no means least, entirely new applications such as e-mobility. All of this is geared towards a set of very clear objectives: maximum efficiency, absolute supply security, and increasing the potential for environmental protection and reduced CO2 consumption in light of climate change.
The smart grids of the future will connect all players in the energy system via a communications network, thus enabling timely, bidirectional and cost-efficient communications between grid components, producers, storage facilities and consumers. To achieve this, ASCR is conducting research in aspern Seestadt on 12 grid stations, 24 transformers of various types and five grid storage systems. On the receiving end, 500 smart meters have been installed in the buildings being researched.
The smart grid migration path
The smart grid of the future will not be created overnight. Instead, we must make use of what is already available, optimise existing copper reserves, and install and apply smart secondary technology (mainly sensors) gradually. ASCR is therefore starting out on a small scale to investigate which sensor technology and which data are actually required in what resolution. Only then will the sensor technology be installed and tested. The final step is to increase efficiency through automation and active control. One of our primary objectives is to keep investment and operating costs for a wide roll-out as low as possible, while at the same time achieving the greatest possible functional capability and safety.
Installing sensor technology
Phase 1: The existing grid learns how to see. Installing sensors makes it possible to monitor grid status – for the first time in a low-voltage grid. In view of the need for cost efficiency, the next question is how many sensors are necessary. The objective is to create a sufficiently accurate map of the grid status to ensure optimal operation while maintaining economic viability.
Software solutions unlock full grid potential
Phase 2: The grid learns how to think. Once the sensor technology has been expanded, the use of software will make it possible to record and monitor factors that were previously hidden, such as grid capacity utilisation. The precise network data allows the infrastructure to be used closer to its physical limits and an early warning signal is sent in the event of an impending boundary breach – no active intervention is necessary. This is especially significant in light of increasing e-mobility and decentralised energy generation.
Optimised interplay in the smart grid
Phase 3: The grid makes decisions in coordination with other components. The next step is an active intervention in the grid infrastructure. Increasing automation means that the grid storage systems can be switched over and activated, and buildings can be actively used as energy storage systems. The smart grid can also shut buildings and photovoltaic systems off from the grid during periods of overcapacity. Optimised interplay between the individual domains increases the efficiency of the entire energy system.
Use Cases
Smart Grid
Installing more sensors facilitates greater accuracy in monitoring the grid, but in addition to higher installation and maintenance costs, it also entails higher data volumes and associated processing costs. The results of ASCR’s research show that a sufficient density of data can be achieved by collecting data every 15 minutes. Increasing the data collection rate does not translate into better, higher quality results.
Installing sensors in the low-voltage grid leads to improved performance, which results in a significant reduction in power outages. Since the number and length of power outages averaged over the operating year are used as a quality indicator with a direct influence on the network fee, this has a positive effect on the network operator’s corporate earnings.
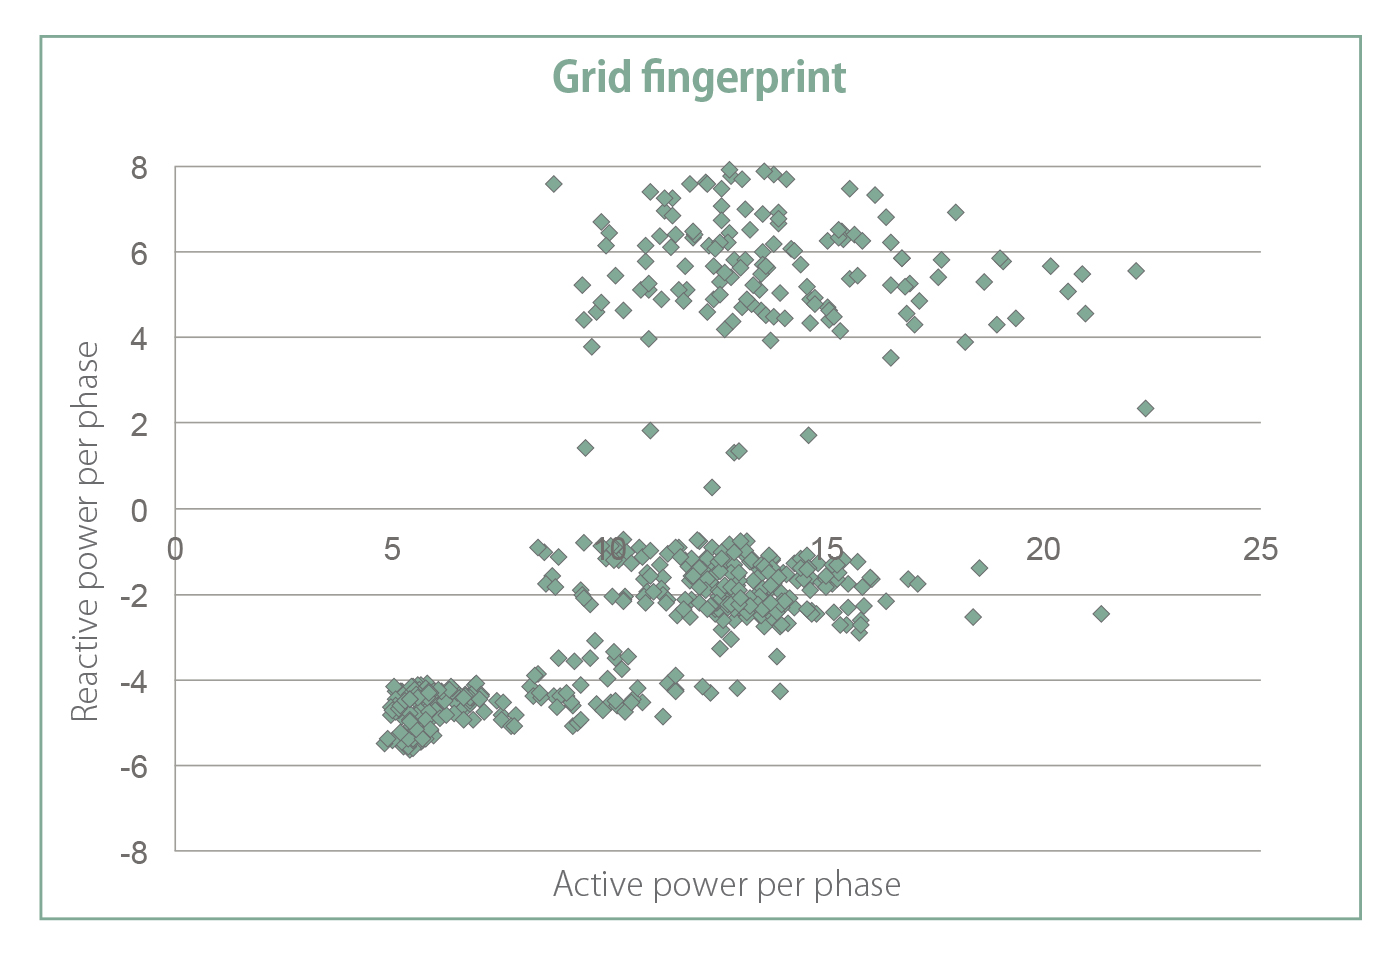
The sensor technology allows the status of various grids to be displayed as a “grid fingerprint”. Each grid status and grid behaviour has a different, easily recognisable pattern, similar to a fingerprint. Differences in time and location are easier to identify, as well as interactions between the battery storage system and network activities.
Monitoring critical threshold values
The increased use of smart meters and other sensor technology makes it easier to identify not only recurring patterns, but also critical threshold values, which can then be handled separately. In order to optimise grid operation, ASCR compares different time periods to determine if thresholds have been breached in the power grid. Thanks to ASCR’s research, major deviations are now immediately visible.

Other interim results for smart grid research
Conventional battery storage systems have not yet been fully developed for use in smart grids. This is a job for manufacturers!
For many analyses, 15-minute effective mean values provide sufficient insight into the distribution grid. However, the minimum and maximum values must also be recorded.
Avoidance of power outages is an economically important factor driving the implementation of a smart grid. This already applies to outages of approximately one minute per year.
The Vienna grid has proven to be very robust; a flexibility operator is only required for very high simultaneities (participation in the energy market). This means that under the present conditions there is no need for flexibility operators, but in the future, with countless feeders and other price-controlled systems, they will play a pivotal role.
Initial findings show that the reactive power breaches the threshold values in individual connection points. However, this reduction in network quality has no noticeable effect on the customer.
A distinction can already be made between consumption curves for normal operation and exceptional situations.
Characteristic failure patterns in the smart meters can be extracted from the data streams.